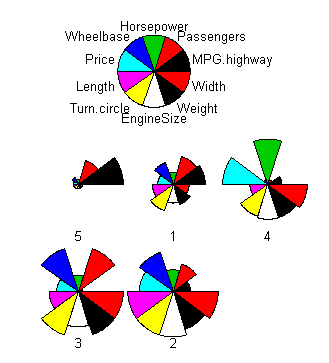
Star plots are a type of geovisualization that enable someone to compare multivariate data using variables and observations. Each star portrays a single observation. The variables that are being compared are plotted on the radii which displays each ones distinct characteristics. The length of the radii is proportional to the intensity of the variable for that data point compared with the maximum intensity of the variable across all of the data points. Star plots are often used to determine which observations are the most similar or if there are any irrelevant observations. The more correlated the variables are the closer they are together on the star plot.The plot above incorporates the star plots of 5 types of cars starting from 1, midsize, luxury, minivan, sporty, and compact. The 10 variables used for this star plot consist of: horse power, passengers, wheel base, MPG highway, width, weight, engine size, turn circle, length, and price. From reading the star plot we are able to deduce that compact car (#5) can fit a few but not too many passengers and has great gas mileage but is not up to par with the rest of the vehicle types in every other category. Star plots would be very useful in comparing these variables while out car shopping.
No comments:
Post a Comment