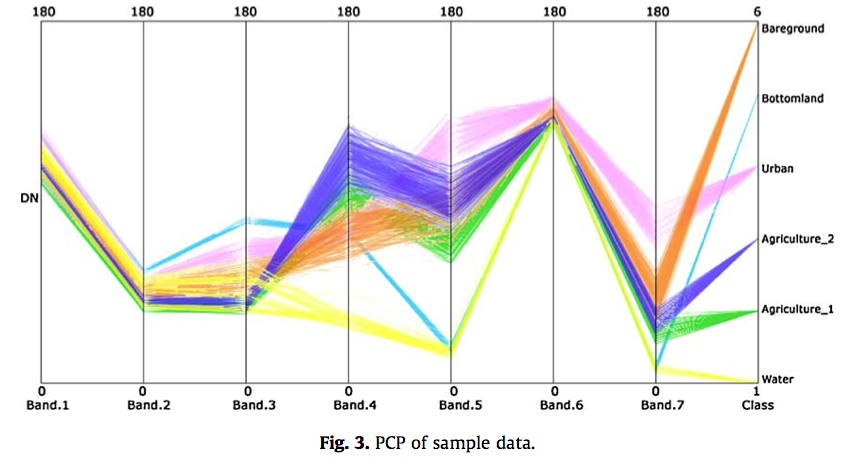
A parallel coordinate plot uses a vertical axis to plot the variables within a set or sets of data. Each set of data is plotted with connected points, with one on each axis. A parallel coordinate plot can be beneficial when attempting to apply and analyze multidimensional graphical data. The plot above uses this technique "highlight the distribution of probability values of different land cover types for each pixel, and also reflect the status of pixels with different degrees of uncertainty." The data collected in the Yellow River Delta, Shandong Province, China from different types of land cover include bare ground, bottomland, urban, agriculture 1 and 2, and water.
No comments:
Post a Comment