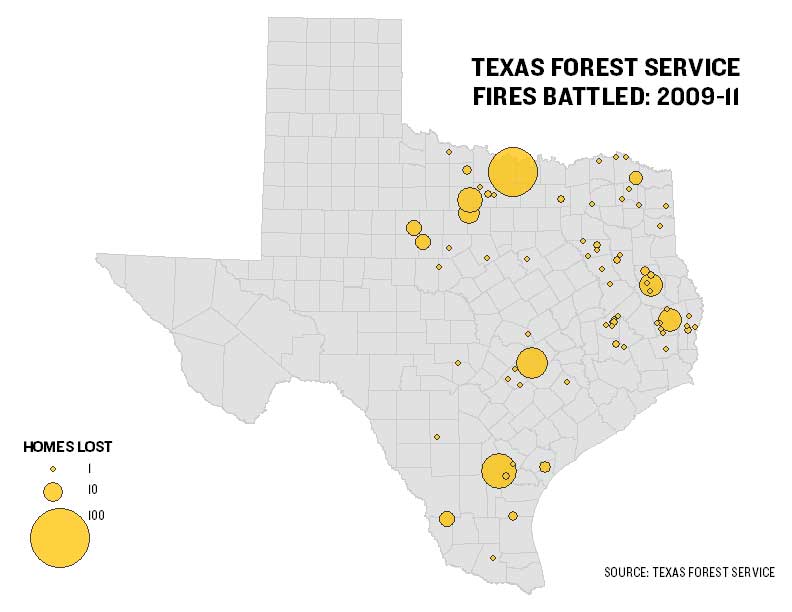
Proportional circle maps are a type of thematic map that us proportional circles to link a theme to a geographic location. Proportional circle maps can either be range graded or continuously graded. Continuously graded proportional circles maps such as the one seen above convey data through the use of all sizes of proportional circles. The graph above is a depiction of the homes in Texas that have been lost due to fire from 2009-2011 according to the Texas Forest Service. The large the circle shown on the map the more homes that were lost due to fire. There is a legend displaying what a circle looks like if 1, 10, or 100 homes were lost to help viewers gauge the amount of homes by comparing the size of the circle of interest to those in the legend. As you can see there is a lot more variation in the size of proportional circles than just the three shown on the legend, because of this aspect the graph is a continuously ranged proportional circle map.
No comments:
Post a Comment